Once you’re tracking and measuring the statistics on your website, it’s very easy to get overwhelmed, hone in on the wrong things, and end up with “analysis paralysis.” (After all, not all of us have Data’s brain.)
It’s not uncommon to hear an executive, new to analytics, say something like, “Oh my God! We have a page that just spiked in its ‘bounce rate.’ What do we do?!?”
Often, that person has overlooked an important detail, such as the fact that the terrible-bounce-rate-page happens to be the “thank you” page, where visitors are expected to leave the site. (In this case, obviously, that particular metric is not a good measurement of performance.)
There’s an allure to big numbers that seem like impressive stats. That’s why so many websites still report the number of hits they receive even though…
…the measurement of hits is outdated and relatively useless.
In the beginning, there wasn’t a way to know whether a customer “came through the door.” By tracking hits, you could only determine that a computer somewhere was requesting data from your website. Unfortunately, a hit included every single thing that a website needed in order to properly display a page (e.g., an image, a link to a file, a script running on a page, etc.). Thus, one visit to a homepage that had multiple photos on it might result in five hits. Despite its relative uselessness as a measurement, companies really liked the stat because it looked impressive and, therefore, stroked their egos.
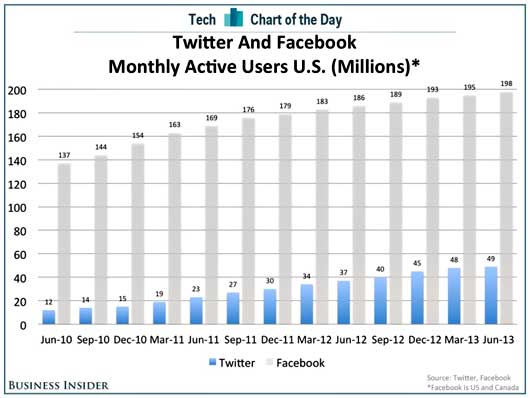
Likewise, tracking users does little to measure a site’s actual performance. Twitter reports that it has a whopping 550 million+ users. What it fails to note, however, is that (as of 2012) only 27% of its user base is active. "In the U.S.," notes Business Insider, "Twitter had only 49 million monthly active users on average during the second quarter of [2013]."
Although some sites hung on dearly to the notion of hits and users, most moved on to looking at “page views.” Then, after installing cookies, they began tracking “visitors” and, later, “unique visitors.” Over time, however, analytics has thoroughly branched out.
Today, there are countless metrics out there, intended to suit all sorts of businesses. But the goal of analytics is not to simply collect a ton of data and spit out a bunch of numbers. Ideally, you want to make positive changes to your website (i.e. enhancements in design or content) and, in turn, increase your bottom line (and/or decrease costs).
In order to improve, though, you have to know what you’re measuring. If you’re not sure what you’re examining, it’s nearly impossible to know whether you’re actually advancing.

What you need to understand is which measurements relate the best to your bottom line. The three main questions you should be asking yourself are:
- What, exactly, am I measuring?
- Is that measurement important?
- If it’s not important, what should I be measuring instead?
The important measurements you will define are more commonly known as “key performance indicators” (KPIs). Like all sites, you’ll probably track your page views and unique visitors.
Your KPIs, however, will vary depending on types of visitors who come to your site. Thus, KPIs are a subset of your analytics that provide you with:
- A report that has specific meaning for your business,
- Key insights that reveal how well you are doing in reaching your goals, and
- The kind of information that can be acted upon.
Hopefully, your measurements will serve as a catalyst to do something different—ideally, something better. What analytics should do, ultimately, is give you insight.
 Some common KPIs include the percentage of new and returning visitors, a list of where your visitors are coming to your site from, as well as a site-wide conversion rate.
If you only look at one thing, look at conversion rate. Regardless of your type of business, you want your visitors to take some sort of action. Thus, you should be measuring to see if there is an increase of people taking that desired action over a period of time.
There are other KPIs that are specific to e-commerce sites, including:
- Sales per visitor,
- Average order value,
- Average number of items purchased,
- Shopping cart abandonment rate,
- Revenue and profit per product, and
- Repeat order rate over a given period (which is used to help calculate “lifetime value”).
Overall, there are certain qualities that make for a truly useful KPI, including how easy it is to understand (and, in turn, communicate to management) and how helpful it is in the decision making process.
 In order to identify what your particular KPIs are, ask yourself the following questions:
- Is it key? In other words, based on your business, is the measurement in question something that relates (either directly or indirectly) to your bottom line?
- Does it measure performance? Does the measurement relate to either increased revenue or decreased cost?
- Is it an indicator? Have you identified a consistent measurement that is capable of showing some sort of meaningful change over time?
There are a thousand types of measurements available to you. Based on your type of business, though, there will be certain metrics that more closely align with your business than others. You need to discriminate and narrow it down to the measurements that actually make you want to improve and give you a general idea of how you might do so.
Once you have a few months’ worth of KPIs under your belt, you’ll probably be able to identify some areas of concern and come up with possible solutions that you’d like to implement in order to improve.
So, tell me: What are some of the key performance indicators for your particular business?